Strategic Benchmarking2024-07-22T13:16:23+00:00

Strategic Benchmarking.

World-leading empirical research on strategic management. Comprehensive data on tens of thousands of years of business experience.

Over 25′000 years of business experience

The PIMS® database contains over 25’000 years of business experience at the Strategic Business Unit (SBU) level (i.e. where the customer interface takes place and where marketing and investment decisions are made). Each SBU is characterized by 500 factors over a period of 3+ years. The companies in the PIMS® database contribute financial data as well as information on customers, markets, competitors, and operations on their companies at the SBU level.

The SBUs in the database are separated into different classifications, specific companies and industries are not identified. Each SBU profile includes financial data from the income statement and balance sheet, as well as information about quality, price, new products, market share, and competitive tactics.

0+
years of real business experience
0+
SBUs from more than 2’000 companies
0
metrics over a period of 3+ years

The choice is yours: PIMS® SaaS or PIMS® Consulting.

Take the power of the PIMS® database into your own hands with the PIMS® software solutions (PIMSSaaS), or leverage our expert consultants by opting for PIMS® as a consulting project.

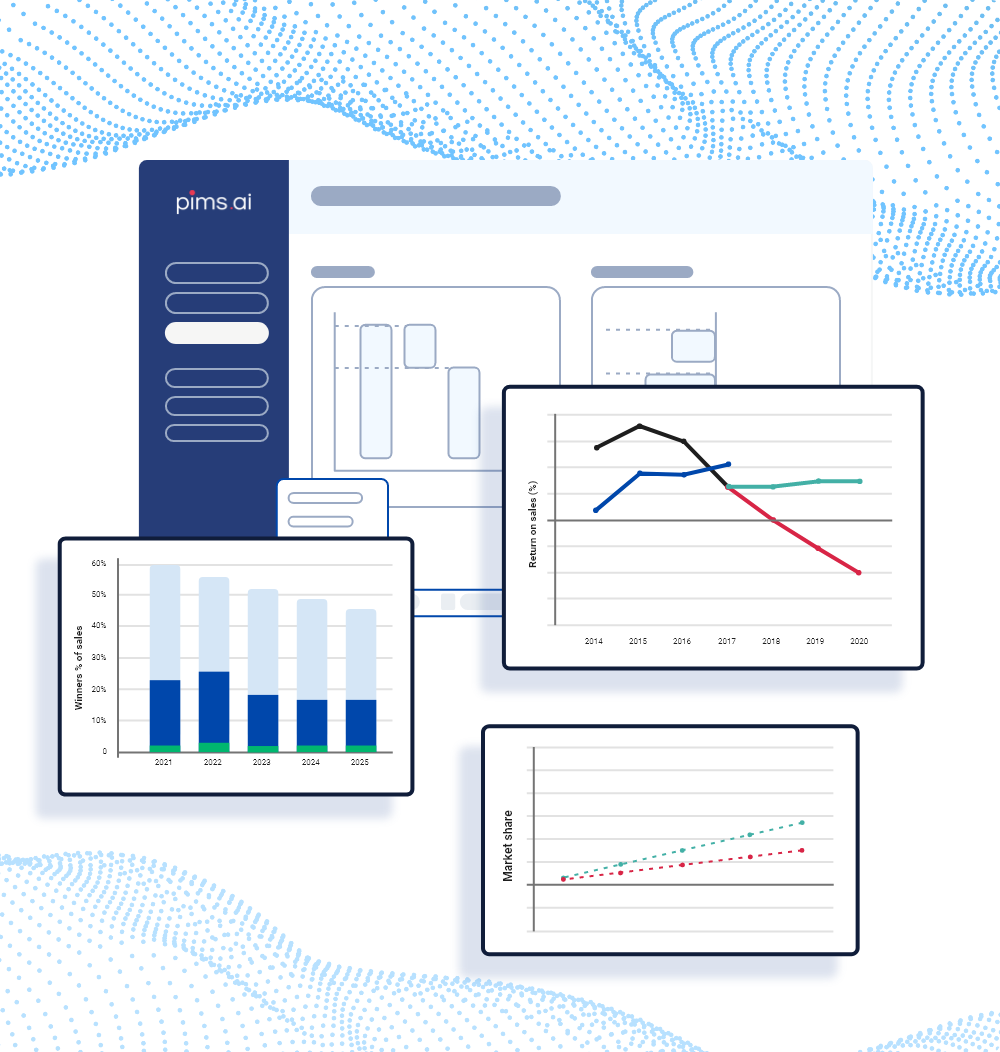
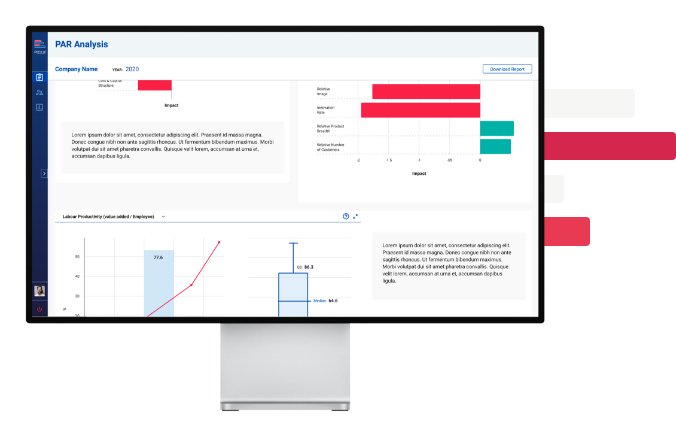
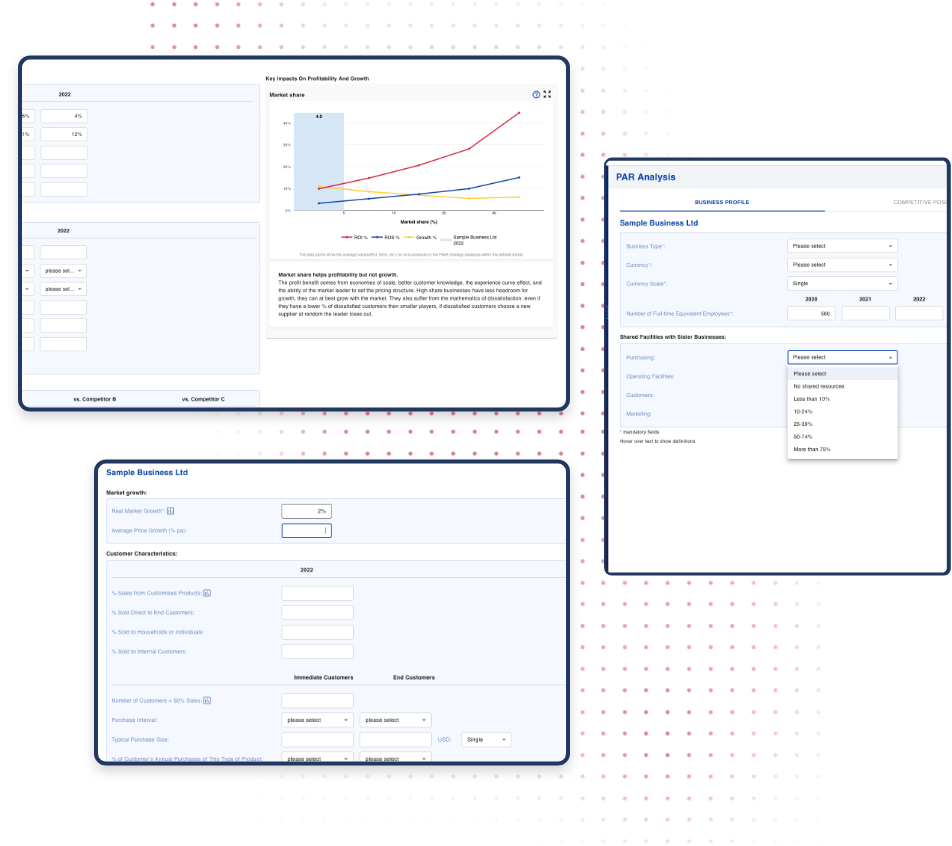
The PIMS® Profit Potential Analysis is a comprehensive evaluation of the profit potential of a Strategic Business Unit (SBU) based on its strategic profile (i.e. competitive position, market environment, and cost & capital structure). We refer to the profit potential of an SBU as the deviation from its PAR. PAR is the expected profitability of an SBU based on a predictive model (a multivariate regression model).

The Profit Potential Analysis enables you to:

  • Quantify the deviation of your SBU’s actual profitability from its PAR
  • Identify the factors within your SBU’s strategic profile that have a positive (or negative) impact on its PAR

The PIMS® Profit Potential Analysis is a powerful instrument in portfolio analysis and is also frequently employed in the due-diligence phase of M&A and start-ups and is available as a Software as a Service (SaaS) or a consulting project.

The PIMS® Strategic Peer Analysis, aims to understand why an SBU’s performance is above or below “PAR” by analysing its income statements and balance sheets of strategically similar businesses in the PIMS database: its “look-alikes”. Furthermore, it enables an SBU to learn from peer businesses with similar cost & capital structures and competitive positions in similar market environments. This analysis can help at all stages of business transformation.

The PIMS® Strategic Peer Analysis is flexible, and the algorithm can be fine tuned to provide insights into many specific issues including barriers to entry, optimal marketing mix and post-merger integration. The outcome of this Analysis is a Report on Look-Alikes (ROLA).

The most common form of a ROLAs are:

  • Operational ROLA: If your profit is below PAR, which operational improvements are most called for? For example, optimise the marketing or R&D spend, streamline the overheads or working capital, etc. The operational ROLA focuses on cross-sectional differences at a single point in time.
  • Strategic ROLA: If you are performing above PAR, which elements of strategic transformation are key? For example, advertising & promotion mix, product versus process R&D, capital investment, etc. The strategic ROLA focuses on changes in your PAR over a period of 3-4 years.

The PIMS® Strategic Peer Analysis is an extension of the Profit Potential Analysis and is available separately as an add-on. Contact us to express your interest.

Gaining a strong market share should be the main aim of a start-up business. This enables economies of scale and should lead to long-term profitability.

Most start-up businesses do not make profits for several years, and those that do make money in the first 2 years have a tendency to perform worse at maturity as they can usually only do this by skimping on areas such as investment, marketing, and second-wave innovation. Profitability should therefore be a long-term goal rather than the initial target for start-up businesses.

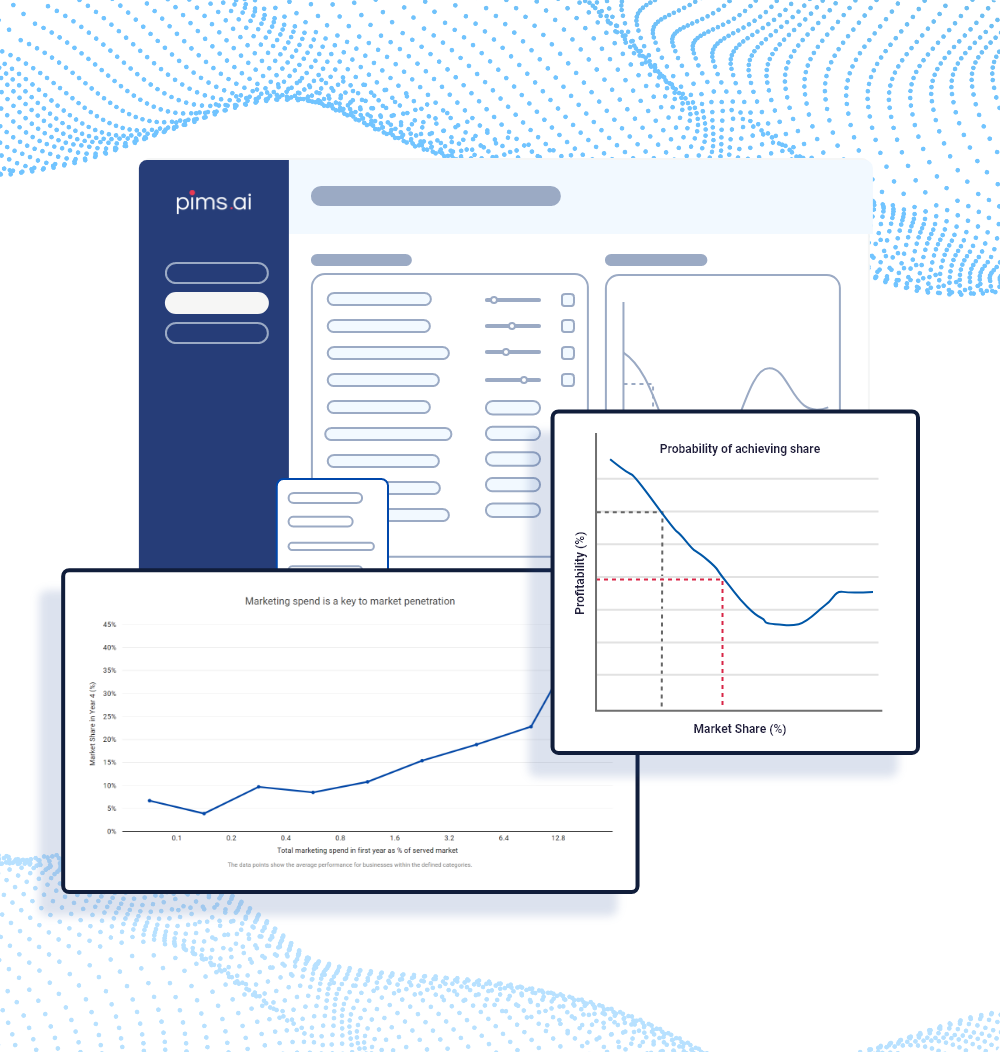
The PIMS® Start-up Market Share Analysis provides an indication of the likelihood of a business achieving a given market share by year 4 based on:

  • Its initial tactics in terms of marketing and other expenditures
  • Its perceived relative quality position.
  • The existing market structure.
  • Its familiarity with the market.

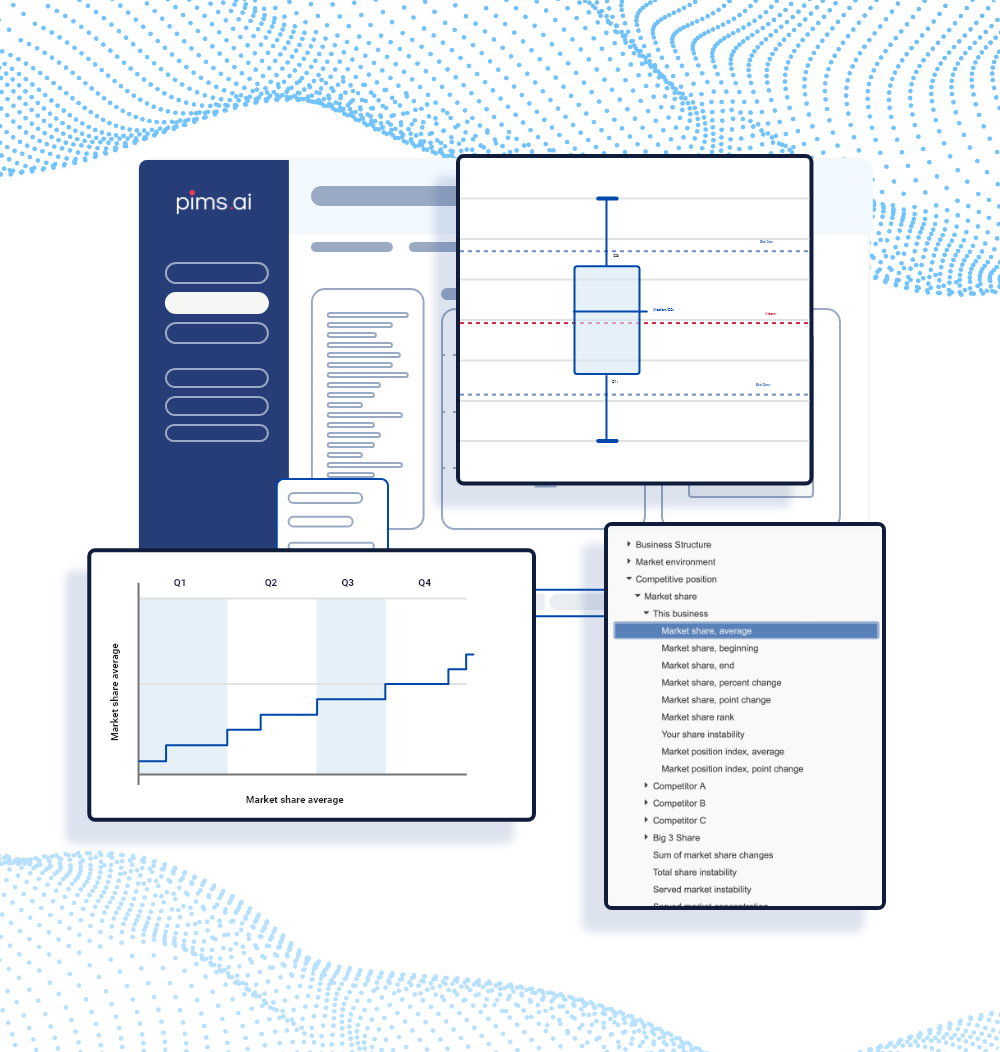
PIMS® QuickStats allows you to leverage the PIMS® database of 4,500+ businesses to quickly obtain valuable insights. For example, you can use PIMS® QuickStats to:

  • Determine the mean market share of a consumer durables business.
  • Ascertain the average ROS (Return on Sales) for a service business.
  • Uncover the typical market growth rate for a consumer non-durable business.

Explore a diverse array of over 500 variables to pinpoint the specific information that piques your interest.

  • Strategic Benchmarking - Profit Potential Analysis
  • Strategic Benchmarking - Strategic Peers Analysis
  • Strategic Benchmarking - Start Up Analysis
  • Strategic Benchmarking - Quick Stats

Use cases.

  • What should you expect your SBU’s costs, margins and working capital to be?
  • Where (and by how much) do you diverge from these figures?
  • What is the right mix of advertising, promotion and salesforce effort?
  • Where do successful strategic peers concentrate their efforts as opposed to less successful ones?


Case: FMCG Business

  • Objective: Maximise growth and profit potential.
  • Solution: Boost the quality offering by creating a premium brand; Refocus advertising & promotion towards marketing and quality brand; Train the sales force in selling a premium product.
  • Results: Significant improvement in sales and margins; vastly increased brand recognition.
  • How are the SBUs in your portfolio performing versus their estimated potential?
  • What should your priorities be for operational improvement?
  • Which SBUs should you invest in and how much? Which should be divested?


Case: Software Business

  • Objective: Strategy: broad range of solutions (one stop shop) or specialist?
  • Solution: Avoid price wars as incumbents would follow.
  • Focus on the customer need (not the product offering) and solve that.
  • Results: Broadening of the perceived offering, solution capability and customer base.
  • What are the potential synergies? How much value does the combination of SBUs create/add?
  • How much should you pay?
  • What should your priorities be during post-merger integration?
  • What are your competitive strengths?
  • What is the likely competitive reaction to new entry in your SBU’s market?
  • How quickly can you penetrate the market?
  • Will you achieve your target returns after entry?


Case: Construction Business

  • Objective: Expand into a new country through acquisition
  • Solution: Reject all acquisition targets based on their poor strategic potential. Enter the market with Greenfield investment
  • Results: Successful Greenfield investment and rapid market penetration.
PIMS Logo

Objectives & Benefits

PIMS® offers a variety of benchmarking tools based on the world-leading empirical database, which will enables you to:

  • Identify your business’ strengths, weaknesses, opportunities, and threats.
  • Learn from historical evidence of performance of real businesses.
  • Identify the best recipe for future success, and prioritise high-impact improvement projects.

Science & Methods

PIMS® Strategic Benchmarking is underpinned by a blend of statistical and AI tools:

  • Multivariate analysis to quantify expected profitability (PAR) and identify strengths and weaknesses.
  • Strategic peer analysis to evaluate options for growth and profitability.
  • Database research for addressing complex problems.

Phases & Steps

  1. SBU definition.
  2. Assembly of existing available data.
  3. Workshops and interviews to fill out data, map into PIMS format, paint scenarios.
  4. Analysis.
  5. Discussion of results and implementation.
PIMS Quote

PIMS contains the insights and evidence which are invaluable for companies that are restructuring to maintain their vitality and market competitiveness. PIMS contains empirical data that shows the strategic reasons why winning businesses win and losers lose.

President, Engineering Company, USA

Thanks to PIMS, for the first time we have a clear picture of our perceived value position relative to our closest competitors, our core strengths and key improvement areas. This will enable us to better align our offering with the customer needs.

National Sales Manager, Global automotive company, Germany

The PIMS Principles puts into a coherent context a unique set of guidelines that have proven to be extremely valuable in the management of businesses across a wide spectrum of industries.
Senior Vice President, Global Bank, USA
PIMS PAR
Go to Top